
MEMBER'S LOGINX
| Invalid Username / Password | ||||||||
| Invalid Captcha | ||||||||
|
||||||||
| Sign Up | Forgot Password? | ||||||||
- Home
- Views On News
- Feb 12, 2024 - Best Defence Stock: Solar Industries vs Premier Explosives
Best Defence Stock: Solar Industries vs Premier Explosives

A country's growth can be gauged by various initiatives, some of them being infrastructure development, growth in the number of erected homes, and availability of basic services like electricity.
While each of these sectors is very important, one sector that supports all these sectors is the explosives industry.
Explosives are primarily used in mining, and construction industries. They are also used by the defence industry.
The global explosives market, which is currently valued at US$ 44 billion (bn), is expected to grow at 6.6% and reach US$ 61.8 billion by 2027.
The Indian explosives industry is one of the world's fastest-growing sectors, with an annual usage of 0.5 million (m) tonnes, and is expected to reach US$ 159.2 m by 2028.
The primary reason is the high demand for explosives across mining, construction, and infrastructure industries.
To add to this, an increase in the use of explosives in defence and space missions has also supported the growth.
With government policies such as Make in India and multiple Defence policies, the growth of the explosives industry is further strengthened.
While all companies involved in explosives manufacturing stand to benefit from this growth, we are comparing two big names - Solar Industries and Premier Explosives - to see who has a better chance to gain from this growth.
Business Overview
# Solar Industries
Solar Industries is a leading manufacturer of bulk explosives, packaged explosives and initiating systems.
Its products find use in mining, infrastructure, and construction industries.
The company has 34 manufacturing plants in India and six manufacturing plants abroad, with a capacity to produce over 450 thousand metric tonnes (MT). Apart from a strong domestic presence, it sells its products in over 51 nations.
It ventured into defence and is manufacturing propellants for missiles, rockers, and warhead explosives.
Recently, the company also forayed into manufacturing propulsion systems for space launch vehicles.
# Premier Explosives
Premier Explosives is engaged in manufacturing industrial explosives and detonators. The company undertakes the operation and maintenance of propellent plants at Sriharikota Centre and the solid fuel complex of DRDO.
It has a wide product portfolio with a monopoly in several products through which it serves its clients, including DRDO, Bharat Dynamics, Coal India, ISRO, Bharat Electricals, and Advanced Systems Laboratory.
The company serves the defence sector and manufactures propellants for tactical and strategic missiles like Astra, Akash, LRSAM, Agni, and Veda.
It has seven manufacturing facilities for explosives and two manufacturing plants for defence equipment in India.
The company has a strong domestic presence and also exports to several countries, including Israel, Greece, Jordan, Nepal, Turkey, Indonesia, Thailand, and the Philippines.
| Particulars | Solar Industries | Premier Explosives |
|---|---|---|
| Market Cap (in Rs billion)* | 585.8 | 14.1 |
| Order Book (in Rs billion)** | 39.1 | 10.5 |
Between the two, Solar Industries has a larger marketcap of Rs 585.8 billion (bn) as compared to Premier Explosives, which has a marketcap of Rs 14.1 bn.
Moreover, Solar Industries also has a higher order book, almost four times that of Premier Explosives.
This is primarily because the company is a leading manufacturer of bulk explosives in the world and has a market share of 24% in the explosives industry.
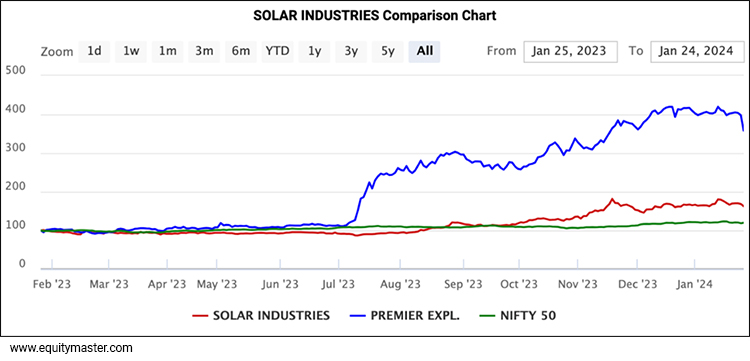
If we compare the performance of both companies on the stock market over the last year, both have outperformed the Nifty 50.
However, Premier Explosives clearly outperformed by giving a 247% return as against the 60.3% return of Solar Industries.
# Revenue
In terms of revenue, Solar Industries outpaced Premier Explosives.
In the last five years, its net sales have grown at a compound annual growth rate (CAGR) of 23%, whereas Premier Explosives' net sales saw a degrowth of 4.4%.
Revenue
| Net Sales (in Rs m) | Mar-19 | Mar-20 | Mar-21 | Mar-22 | Mar-23 | 5-Year CAGR |
|---|---|---|---|---|---|---|
| Solar Industries | 24,616 | 22,373 | 25,156 | 39,476 | 69,225 | 23.00% |
| Premier Explosives | 2,530 | 1,645 | 1,536 | 1,991 | 2,020 | -4.40% |
Sharp increases in realisations and strong volume growth have helped Solar Industries grow its revenue.
Apart from this, the company's leadership position in the explosives industries, strong relations with its reputed clientele, and high demand from user industries have supported revenue growth.
On the other hand, Premier Industries' revenue saw a degrowth primarily because of the tender-based orders in the commercial explosives segment and the long gestation period for the execution of defence orders.
However, in the last three years, the company's revenue increased due to high demand from user industries and a growing share of defence revenue.
With a high inflow and faster execution of defence orders, the revenue is expected to grow further.
# Profitability
In the last five years, the earnings before interest tax depreciation and amortisation (EBITDA) of Solar Industries has grown at a CAGR of 21%, as against the Premier Explosives, which saw a growth of 2.1%.
Solar Industries' profit after tax grew by a CAGR of 24%, whereas Premier Industries witnessed a degrowth of 9.1%.
Profitability
| EBITDA (in Rs m) | Mar-19 | Mar-20 | Mar-21 | Mar-22 | Mar-23 | 5-Year CAGR |
|---|---|---|---|---|---|---|
| Solar Industries | 4,959 | 4,343 | 5,146 | 7,346 | 12,887 | 21.00% |
| Premier Explosives | 233 | -52 | -28 | 209 | 259 | 2.10% |
| PAT (in Rs m) | Mar-19 | Mar-20 | Mar-21 | Mar-22 | Mar-23 | 5-Year CAGR |
| Solar Industries | 2,768 | 2,787 | 2,881 | 4,555 | 8,112 | 24.00% |
| Premier Explosives | 113 | -100 | -110 | 52 | 70 | -9.10% |
| Gross Profit Margin | Mar-19 | Mar-20 | Mar-21 | Mar-22 | Mar-23 | |
| Solar Industries | 20.10% | 19.40% | 20.50% | 18.60% | 18.60% | |
| Premier Explosives | 9.20% | -3.20% | -1.80% | 10.50% | 12.80% | |
| Net Profit Margin | Mar-19 | Mar-20 | Mar-21 | Mar-22 | Mar-23 | |
| Solar Industries | 11.20% | 12.50% | 11.50% | 11.50% | 11.70% | |
| Premier Explosives | 4.50% | -6.10% | -7.10% | 2.60% | 3.40% |
Solar Industries is clearly leading in terms of profitability primarily due to backward integration. The company manufactures the majority of its raw materials internally.
To add to this, the company has a price escalation clause in its agreement with key clients that reduces the risk of raw material price volatility on its margins.
For Premier Explosives, volatility in raw material prices and fixed price contracts of the defence segment have led to a fall in profits over the years. This also affected the profit margins.
However, a growing share of defence in the company's revenue will help the company improve its margins in the medium term.
# Debt Management
The debt-to-equity ratio of Solar Industries is 0.2x. In the last five years, the company's debt-to-equity ratio increased due to its capex plans.
The company also increased its borrowing limit to Rs 30 bn in the financial year 2022.
For the financial year 2024, the company is planning a capex of Rs 7 billion (b) for modernisation and capacity expansion.
Moreover, in the next two years, the company is planning to invest Rs 6 bn annually for capex.
Coming to Premier Explosives, the company's debt-to-equity ratio is zero despite investing heavily in capex.
In the last few years, it has invested in a greenfield plant to manufacture solid propellant. It also invests heavily in research and development (R&D) to develop new products.
Moreover, the company has no major capex planned and hence has sufficient cashflows to fund its operations.
Debt Management
| Debt to equity ratio (x) | Mar-19 | Mar-20 | Mar-21 | Mar-22 | Mar-23 |
|---|---|---|---|---|---|
| Solar Industries | 0.1 | 0.2 | 0.3 | 0.2 | 0.2 |
| Premier Explosives | 0 | 0 | 0.1 | 0 | 0 |
# Financial Efficiency
To measure the financial efficiency of a business, it is important to look at its return ratios.
These ratios are Return on Capital Employed (RoCE) and Return on Equity (RoE). They indicate a company's ability to generate profits from capital invested.
The RoCE and RoE of Solar industries have been expanding continually owing to rising profits.
On the other hand, Premier Explosives' ratios have fallen due to a fall in profit. However, in the last two years, the return ratios have improved, leading to an improvement in revenue and profit.
Financial Efficiency
| ROCE | Mar-19 | Mar-20 | Mar-21 | Mar-22 | Mar-23 |
|---|---|---|---|---|---|
| Solar Industries | 32.50% | 23.90% | 22.00% | 28.00% | 38.70% |
| Premier Explosives | 9.90% | -4.50% | -4.20% | 7.30% | 9.30% |
| ROE | Mar-19 | Mar-20 | Mar-21 | Mar-22 | Mar-23 |
| Solar Industries | 22.40% | 20.20% | 18.20% | 23.80% | 31.10% |
| Premier Explosives | 5.40% | -5.10% | -5.90% | 2.80% | 3.60% |
# Dividend
A company distributes its profits to shareholders in the form of dividends. If a company pays dividends regularly, it indicates stability in its financial health.
Dividend
| Dividend Per Share (Rs) | Mar-19 | Mar-20 | Mar-21 | Mar-22 | Mar-23 | 5-Year CAGR |
|---|---|---|---|---|---|---|
| Solar Industries | 7 | 6 | 6 | 7.5 | 8 | 2.70% |
| Premier Explosives | 2.7 | 0 | 0 | 1.5 | 1.7 | -8.80% |
| Dividend Yield | Mar-19 | Mar-20 | Mar-21 | Mar-22 | Mar-23 | |
| Solar Industries | 0.60% | 0.60% | 0.50% | 0.40% | 0.20% | |
| Premier Explosives | 1.00% | 0.00% | 0.00% | 0.60% | 0.40% | |
| Dividend Payout Ratio | Mar-19 | Mar-20 | Mar-21 | Mar-22 | Mar-23 | |
| Solar Industries | 22.90% | 19.50% | 18.80% | 14.90% | 8.90% | |
| Premier Explosives | 25.80% | 0.00% | 0.00% | 30.90% | 26.20% |
Solar Industries average dividend payout stood at 17%, and its dividend yield is 0.4%.
In contrast, Premier Explosives five-year average payout is 16.5%, and dividend yield is 0.4%.
Solar Industries is paying a higher dividend per share than Premier Explosives. However, the five-year average dividend payout and dividend yield for both companies is similar.
# Valuations
To know the real worth of a company, we must look at its valuation. It gives us an idea of whether the company is overvalued or undervalued and helps in making investing decisions.
The two important valuation ratios to look at are Price to Earnings (P/E) and Price to Book Value (P/Bv). A high ratio, when compared to the peers, indicates the company is overvalued, and a low ratio indicates it is undervalued.
| Valuations | Solar Industries | 5-Year Average | Premier Explosives | 5-Year Average |
|---|---|---|---|---|
| P/E (x) | 68.8 | 37.4 | 58.7 | 21.8 |
| P/B (x) | 21 | 8.7 | 7 | 1.3 |
In terms of P/E and P/BV, Solar Industries is overvalued when compared to Premier Explosives. Moreover, when compared to the five-year average, both companies look overvalued.
When compared to the industry average, again, both companies are overvalued.
Solar Industries vs Premier Explosives: Which Stock is Better?
In terms of revenue, revenue growth, profitability, and financial efficiency, Solar Industries has the upper hand compared to Premier Explosives.
However, in terms of valuations and debt management, Premier Explosives outpaced Solar Industries.
The company, although a small player when compared to its competitors, has made its mark in the industry.
It has a leadership position in India in manufacturing explosives and detonating fuse with indigenous technology.
Moreover, it is the first private company to manufacture propellants for Indian missile programs.
The company is a member of the Missile Technologies Control Group (MTCR), India, which provides it access to advanced technologies.
It has collaborated with universities such as BITS Pilani, Gulbarga University, and IIT Madras to conduct research in high-energy materials.
It has invested in R&D and is working on developing new products, such as 70 mm rockets and air-glide bombs for the Indian Air Force.
The company also received licenses for bulk storage of ammonium nitrate (solid and melt), which will help the company reduce its raw material costs and ensure a sufficient supply.
Solar Industries, on the other hand, has a leadership with a 24% market share in industrial explosives. It has a sizable manufacturing capacity, allowing it to scale up production during peak demand season.
The company is also setting up new facilities in Australia, Thailand, and Indonesia to scale up its production further.
It has entered into a partnership with ISRO to manufacture space launch vehicles and is scaling up its defence product portfolio to expand its business.
All this shows that both companies are gearing up to meet the growing need for explosives and defence products.
While Solar Industries is a well-established player in the explosives industry, Premier Explosives is focusing on its defence and space portfolio.
With the high demand for explosives, both companies are well-positioned to benefit from it.
Safe Stocks to Ride India's Lithium Megatrend
Lithium is the new oil. It is the key component of electric batteries.
There is a huge demand for electric batteries coming from the EV industry, large data centres, telecom companies, railways, power grid companies, and many other places.
So, in the coming years and decades, we could possibly see a sharp rally in the stocks of electric battery making companies.
If you're an investor, then you simply cannot ignore this opportunity.
Details of our SEBI Research Analyst registration are mentioned on our website - www.equitymaster.comDisclaimer: This article is for information purposes only. It is not a stock recommendation and should not be treated as such. Learn more about our recommendation services here...
ABOUT EQUITYMASTER
Since 1996, Equitymaster has been the source for honest and credible opinions on investing in India. With solid research and in-depth analysis Equitymaster is dedicated towards making its readers- smarter, more confident and richer every day. Here's why hundreds of thousands of readers spread across more than 70 countries Trust Equitymaster.
PREMIUM PRODUCTS
QUICK LINKS
POPULAR TOPICS
- Multibagger Penny Stocks
- Basics of Value Investing
- Benjamin Graham
- How to Invest in Gold
- How to Invest in Silver
- Best Stocks to Buy Today
- Best Small-cap Stocks to Buy
- Best Bluechip Stocks to Buy
- Guide to Penny Stocks
- How to Invest in the Share Market
- Warren Buffett - The Value Investor
- Pick the Best Multibagger Stocks
TRENDING TOPICS
 Donate to credible NGOs in the sector of your choice (ii) Claim 50% tax benefit u/s 80G (iii) Receive periodic reports.")
Copyright © Equitymaster Agora Research Private Limited.
Whitelist | Refer | Terms | Privacy | Contact | About | Sitemap
Equitymaster Agora Research Private Limited (Research Analyst)
SEBI (Research Analysts) Regulations 2014, Registration No. INH000000537.
103, Regent Chambers, Above Status Restaurant, Nariman Point, Mumbai - 400 021. India.
Telephone: +91-22-61434055. Email: info@equitymaster.com. Website: www.equitymaster.com.
CIN:U74999MH2007PTC175407
Name of the Compliance & Grievance Officer: Ms Sonal Ramachandran
Telephone: +91-22-61434003 | Email: compliance@equitymaster.com
LEGAL DISCLAIMER:
Investment in securities market are subject to market risks. Read all the related documents carefully before investing.
Registration granted by SEBI and certification from NISM in no way guarantee performance of the intermediary or provide any assurance of returns to investors.
All rights reserved. Any act of copying, reproducing or distributing this newsletter whether wholly or in part, for any purpose without the permission of Equitymaster is strictly prohibited and shall be deemed to be copyright infringement.
Equitymaster Agora Research Private Limited (Research Analyst) bearing Registration No. INH000000537 (hereinafter referred as 'Equitymaster') is an independent equity research Company. Equitymaster is not an Investment Adviser. Information herein should be regarded as a resource only and should be used at one's own risk. This is not an offer to sell or solicitation to buy any securities and Equitymaster will not be liable for any losses incurred or investment(s) made or decisions taken/or not taken based on the information provided herein. Information contained herein does not constitute investment advice or a personal recommendation or take into account the particular investment objectives, financial situations, or needs of individual subscribers. Before acting on any recommendation, subscribers should consider whether it is suitable for their particular circumstances and, if necessary, seek an independent professional advice. This is not directed for access or use by anyone in a country, especially, USA, Canada or the European Union countries, where such use or access is unlawful or which may subject Equitymaster or its affiliates to any registration or licensing requirement. All content and information is provided on an 'As Is' basis by Equitymaster. Information herein is believed to be reliable but Equitymaster does not warrant its completeness or accuracy and expressly disclaims all warranties and conditions of any kind, whether express or implied. Equitymaster may hold shares in the company/ies discussed herein. As a condition to accessing Equitymaster content and website, you agree to our Terms and Conditions of Use, available here. The performance data quoted represents past performance and does not guarantee future results.
Equitymaster requests your view! Post a comment on "Best Defence Stock: Solar Industries vs Premier Explosives". Click here!
Comments are moderated by Equitymaster, in accordance with the Terms of Use, and may not appear
on this article until they have been reviewed and deemed appropriate for posting.
In the meantime, you may want to share this article with your friends!